Mastering Engagement
Set product strategy for great user engagement, go in-depth on engagement loops, stickiness, and activation, and learn from top examples.
The Three Games of Engagement
Most products disappear into obscurity almost as soon as they’re out of the press spotlight. Research shows that the average app loses almost its entire user base in just three months. Even if the latest media buzz or marketing campaign brings in a wave of new signups, most products miss the mark on delivering actual value to their new users—and if those users don’t find meaningful value early on, they’re gone before you have a chance to show them anything more. That’s why having a strategy for user engagement is so critical.
1.1 | Why user engagement matters
In the Product Analytics Playbook Volume I, we introduced the Retention Lifecycle Framework—a framework for analyzing retention depending on whether a user of your product is new, current, or resurrected. User engagement is what directs the flow of users between each of these buckets.
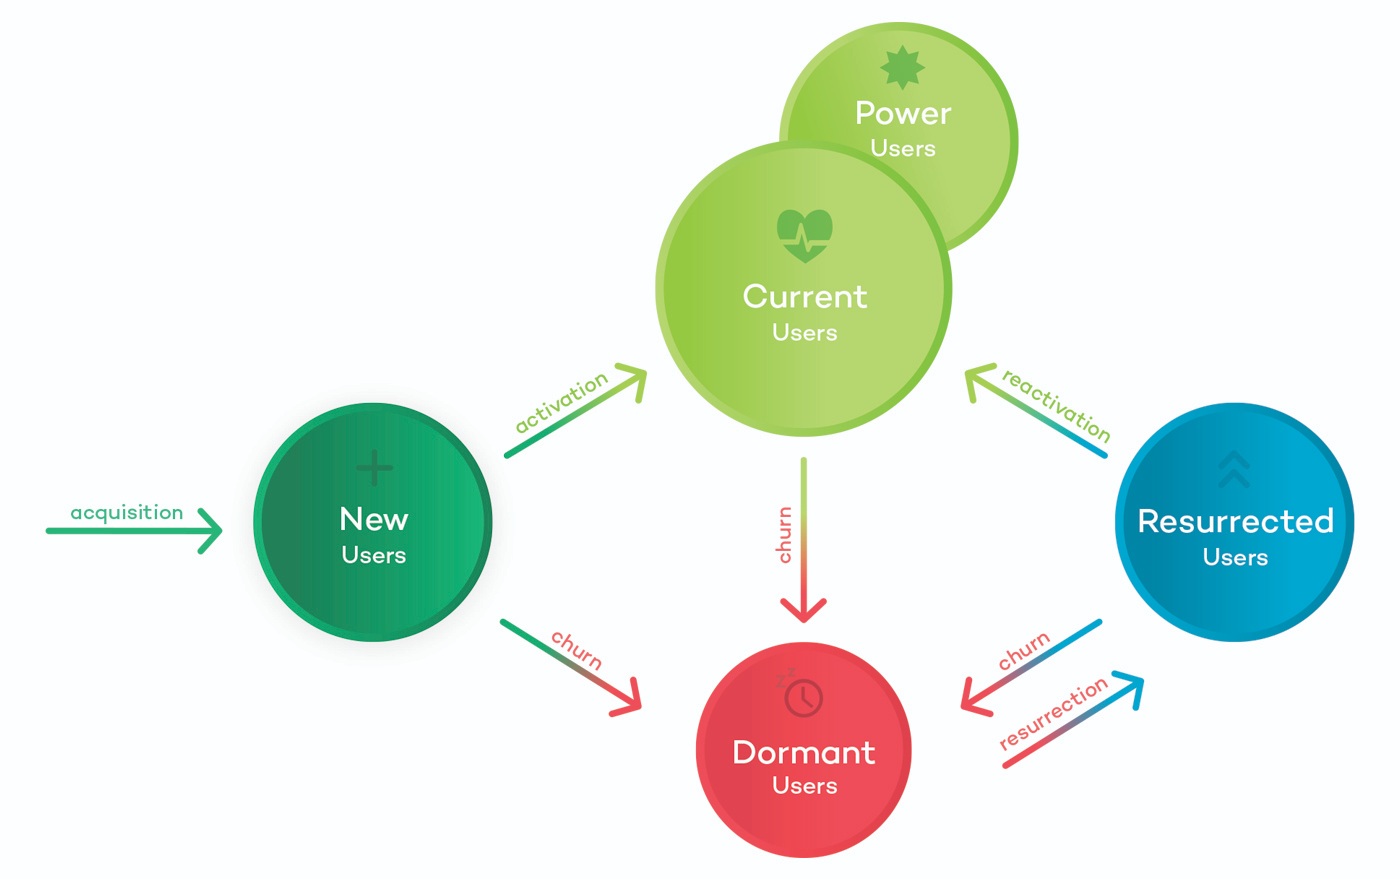
After a new user is onboarded (or a churned user is resurrected), that user must engage with the product through a number of value-adding interactions before being activated into a regular current user. A current user who then becomes more and more engaged with different dimensions of your product can then become a power user.
Terms to Know
– Retention is a measure of how many users return to your product over time after some initial event (usually first use).
– Engagement is a measure of how much or how often users interact with your product.
Onboarding is a series of steps within your product designed to show new users how they can use the product to obtain value.
– Activation is a point or phase at the end of Onboarding during which a new user obtains enough value from the product such that they become a current active user of the product.
– Stickiness is a measure of the frequency with which people use your product; specifically, a measure of the number of days out of a week or a month that a user was active, or did a specific action.
Engagement matters because, ultimately, it drives revenue. If you consistently deliver value to your users and help them discover that value, they’ll stay engaged with the product, keep coming back, and keep wanting to invest their time and money into your product.
1.2 | Which engagement game are you playing?
Based on our research of products at over 12,000 companies and 5 trillion user actions, we have learned that all digital products play one of three possible games of user engagement. They’re either playing to win attention, transaction, or productivity:
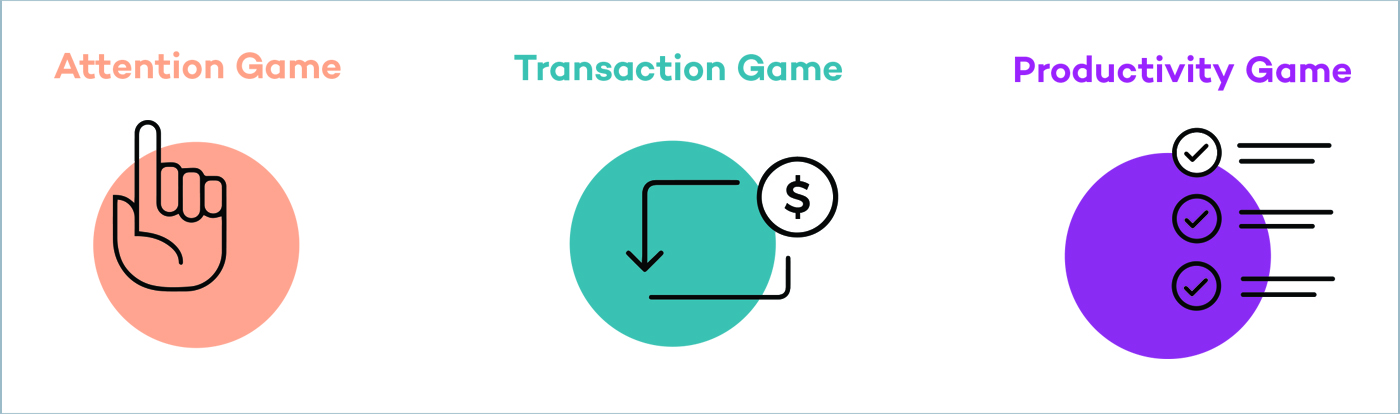
The Attention Game: Products playing this game are trying to maximize the amount of time users spend in-product. Industries that typically play this game today are media, gaming and any company displaying advertisements to you.
The Transaction Game: Products playing this game help customers make purchase decisions with confidence. Companies you will often find playing this game are e-commerce platforms.
The Productivity Game: Products playing this game create an easy and reliable way to complete an existing task or workflow for the user. This game is predominant in business-to-business software.
At product-led companies, the product team isn’t simply a cost center of the business whose success is measured by the number of things shipped. By solving customer pain and building things that deliver value, product teams have a very real impact on the business—that’s why building a great product should be treated like a game of chess.
Just as chess grand masters have to analyze the board to map out their strategy, (sometimes up to eight moves in advance!), so must product managers proactively analyze the set up of their customer engagement game.
Once you know your game, with the right tactics in place, PMs can get users to their aha moment faster, start them on their journey up the engagement ladder, and set them up in successful engagement loops—but more on this in Chapter 2 and 3.
The first order of business is to ask yourself which engagement game you are playing and then define the right metrics of success for your game.
PRO TIP
The Amplitude product team has run dozens of workshops with large, digital businesses to help them refine their product strategy.
When we share the Three Games of Engagement framework with product managers and executives, their first reaction is to say that all three engagement games are important to them. While this is true, making a clear choice about which game matters most is what strategy is all about. Strategy is what you say no to. Product teams need to make a clear choice about whether they are playing the attention, transaction, or productivity game so they can focus on winning it.
1.3 | Defining a north star that drives engagement
A north star metric is the key measure of success for the product team in a company. It defines the relationship between the customer problems that the product team is trying to solve and the revenue that the business aims to generate by doing so.
The product north star serves three critical purposes in any company:
- It gives your organization clarity and alignment on what the product team is optimizing for and what can be traded off.
- It communicates the product organization’s impact and progress to the rest of the company, resulting in more support and acceleration of strategic product initiatives.
- Most importantly, it holds product teams accountable to an outcome.
PRO TIP
Beware of vanity metrics, especially for your north star. "Daily Active Users" or "Registered Users" are not good core KPIs because they say nothing about what engages your customers. When teams fail to connect engaged customer value directly to their north star metric, they risk leading their business down the wrong path.
Purpose #3 is where aligning your north star metric with your engagement game becomes crucial. If you measure product success on a north star that doesn’t represent customers using your product in a way that they get value, you risk optimizing for the wrong metric and ultimately the wrong outcome.
For instance, suppose you’re on the product team at an e-commerce company and you should be playing the transaction game—when a customer completes a transaction, you win. But let’s say you and your team don’t clearly define the game you’re playing. Instead of shipping features that get customers to make purchases, you end up shipping features that increase the time customers spend browsing for goods. This might not do your business much good. In fact, it might do harm if you inadvertently decrease the number of purchases being completed.
TERMS TO KNOW
– A north star metric defines the relationship between the customer problems the product team is trying to solve and the revenue the business aims to generate by doing so.
– A KPI, also known as a Key Performance Indicator, is a measurable value that demonstrates how well an organization is achieving its current objective.
– An OKR, also known as Objectives and Key Results, is a framework for defining and tracking company, team, or personal objectives.
– A leading indicator is a value or measurement that can be used to indicate future business outcomes. Good north star metrics are leading indicators of success. On the other hand, metrics like ARPU and monthly revenue are lagging indicators.
Knowing which engagement game you’re playing is the first step towards defining a north star metric and set of KPIs that focuses your team’s efforts on shipping features that create value for customers, and ultimately helps you win.
EXAMPLE
When LinkedIn Endorsement’s past north star metric drove the wrong engagement game
In 2012, LinkedIn introduced their ‘Endorsements’ feature. Endorsements allowed LinkedIn users to vouch for the expertise of other users. It served as validation of a user’s skills and expertise as well as a way for recruiters to find candidates with specific skills.

Initially, the north star metric for Endorsements was total endorsements given. In order to increase this metric, LinkedIn suggested endorsements for users to give their connections.
What the team discovered, however, was that although the suggestions did prompt more users to endorse their connections (and thus boosted their north star), this didn’t actually result in increased product value. In fact, because endorsing in bulk became so easy, the meaning of a LinkedIn Endorsement became devalued. Users expressed not trusting Endorsements—the complete opposite of what LinkedIn had intended with the feature.
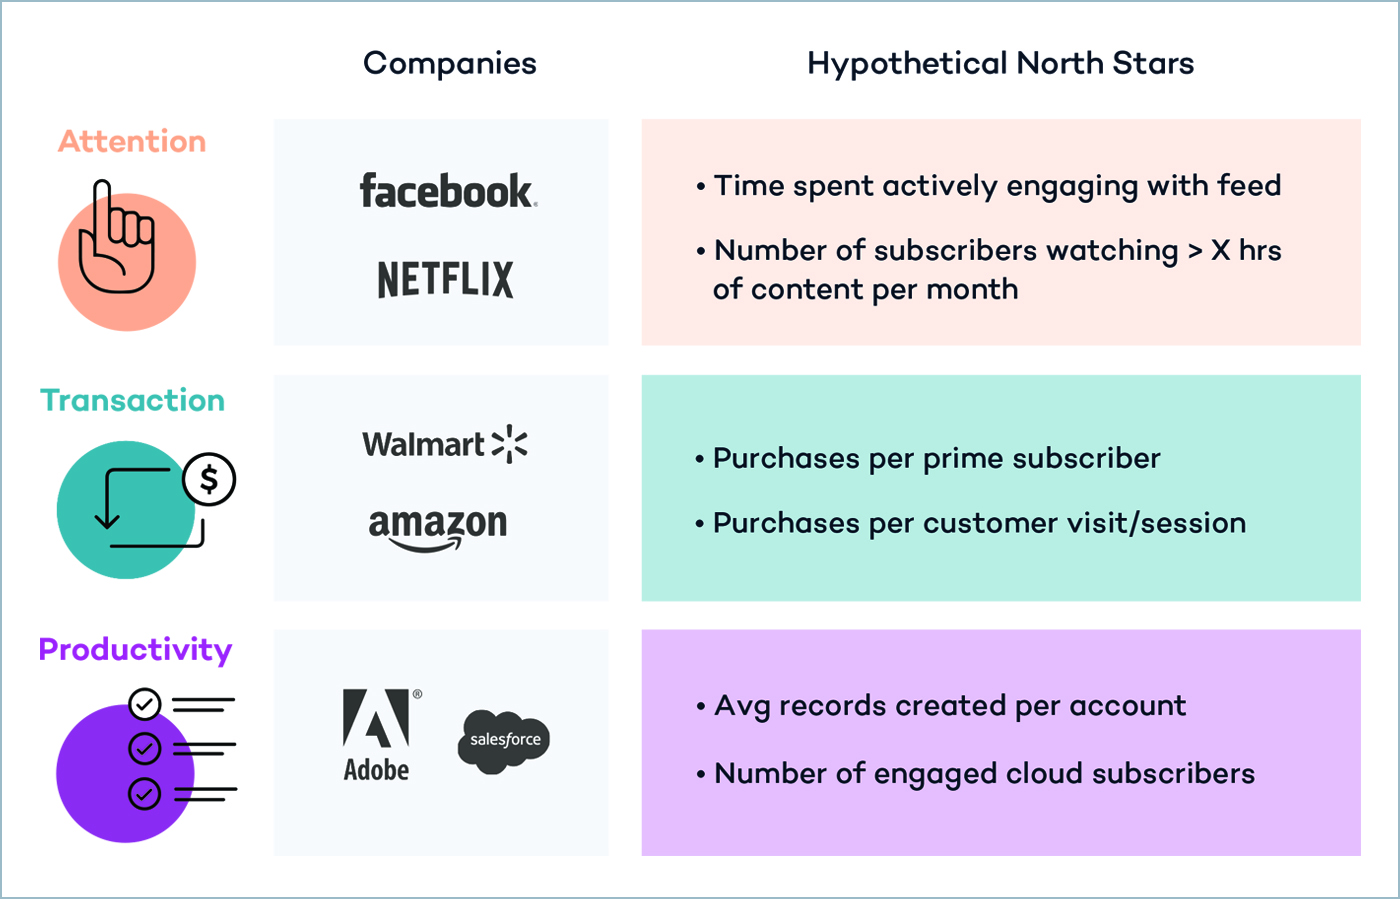
Here are some hypothetical north stars from companies playing each of the three engagement games. One important thing to keep in mind: companies playing the same game can have radically different north stars because it reflects their unique product strategy.
Players of the attention game:
Facebook vs. Netflix
While Facebook and Netflix both play the attention game, their business models are radically different. Facebook’s revenue is proportional to the amount of feed engagement and hence ad revenue generated. Netflix, on the other hand, follows a subscription model with a fixed (but growing) amount of content. Let’s say Netflix read our Mastering Retention playbook and found out that subscribers watching greater than X hours of content per month were more likely to be retained the next month. Instead of focusing on total time spent watching content, Netflix’s north star should be about getting more subscribers to watch that amount of content.
Players of the transaction game:
Amazon vs. Walmart
Similarly, Amazon Retail and Walmart might have very different north stars despite being players in the same transaction game. Amazon is likely optimizing for the number of Amazon Prime subscribers and the value that it generates for them, especially since the Prime subscription gives Amazon visibility into customer loyalty and lifetime value. Walmart, on the other hand, is a cost leader—a company that has competitive advantage by having the lowest cost of production in the industry—and is probably focusing on increasing the percentage of their customers’ spend over time.
Players of the productivity game:
Salesforce vs. Adobe
Salesforce aims to be the central source of truth for customer records at B2B companies. Their latest strategy revolves around AI for decision making in sales. This means that their north star would be less about user adoption and more about the amount of customer data they store for their accounts. On the other hand, Adobe Creative Cloud likely focuses on individual subscribers and driving enough engagement to ensure continued subscription.
Product teams need to start their strategic planning by defining the engagement game they are playing. This, along with their business strategy, informs their product north star metric. Getting your engagement game and north star metric right is the core of product strategy and organization. At the end of this chapter you will find a helpful template that will allow you to have this discussion in your own organization.
The engagement game defines much more than the core KPIs a product should track. The specific game you’re playing also dictates fundamental concepts around the product-customer value exchange that you should be designing into your application workflows.
1.4 | Defining customer value exchange for your game
Modern management theory defines a product as a medium of value exchange between a user and a business.
The product offers value to a customer—entertainment, efficiency, status etc.—and the customer in return offers compensation to the business. At the core of building a product that engages users is having a true understanding of the actions within your product that provide realized value to the customer.
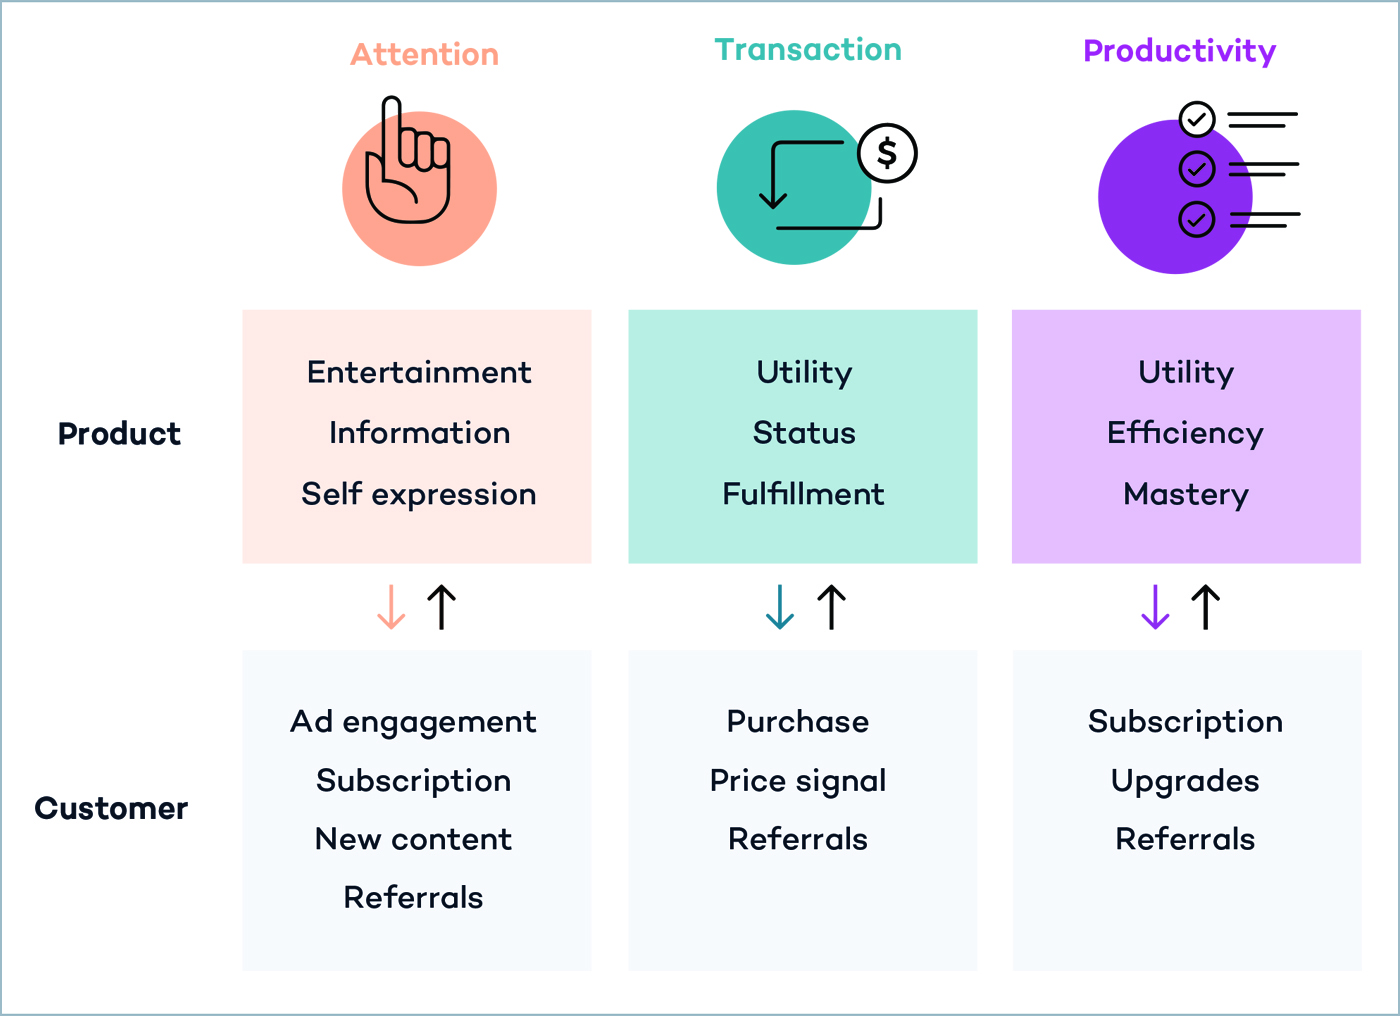
These moments of value exchange look different depending on the kind of product you’re building and thus the engagement game you’re playing. These days, business model innovation and digital transformation have broadened the number of ways in which customers can offer this compensation. Apart from one-time or recurring payments, customers can now offer their time by engaging with ads, offer referrals, or simply offer information about their preferences.
Let’s take a look at how to create customer value in each of the three types of engagement games.
Creating customer value in the attention game
When your product is playing the attention game, you are vying for your users’ time. In return, you offer them entertainment, information, stimulation and/or emotional relief. The easier and better you offer this value, the more time customers spend using your product. Industries that typically play this game today are digital media, social media, gaming and other types of products showing you advertisements.
Entertainment, information and self expression are the three core values that an attention product can offer a customer. Great products playing the attention game paint a picture of endless content choice and use customer engagement data to personalize the user experience (more on this in Chapter 4).
For products playing the attention game, your success in creating value for your users can be measured by asking yourself how much of your their time you are capturing. Examples of metrics you might care about are: time spent within the product, number of sessions over a period of time, or how many times users performed a critical event over a period of time.
EXAMPLE
Twitter video plays the attention game
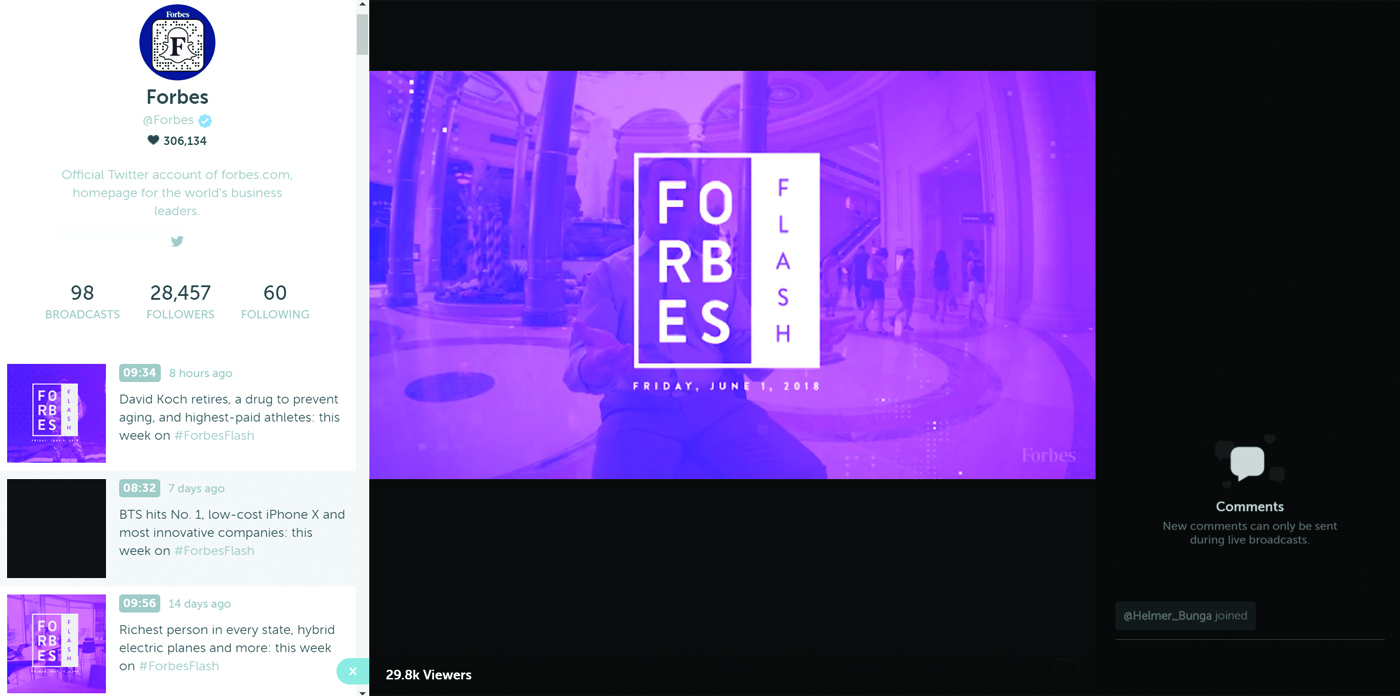
Twitter’s video and live-streaming platform is a prime example of a product playing the attention game. Twitter’s number of daily video views nearly doubled in the past year and contributed to more than half of their ad revenue for two consecutive quarters.
A clear exchange of value had taken place: customers were receiving entertainment and information and the business was receiving ad engagement in exchange. This prompted the social media giant to sign up with companies like NBCUniversal and Walt Disney to offer more news and entertainment in video format source.
Creating customer value in the transaction game
Products playing the transaction game generate value via commercial transactions taking place online. Companies you will most often find playing this game are e-commerce platforms—from retail giants to smaller marketplaces and subscription services.
In this game, endless browsing or comparison shopping might boost your vanity metrics but they don’t add value. At the end of the day, you should care about getting users to add things to a cart, enter in their credit card number, and complete their transaction.
Products playing the transaction game offer a few different types of value to a customer. Some businesses, like Walmart.com and Amazon, chiefly offer the customer utility. These companies are extremely focused on price points and shipping. In fact Eugene Wei, an early product manager at Amazon, said that customers cared about shipping costs to an irrational extent. Customers who shop with these brands feel assured they are getting the best deals on their purchases without ever leaving the comfort of their home.
Transaction-focused companies that take a more curated approach in their product offer status and fulfillment to their customers. In this value exchange, the price of the purchase matters less than the satisfaction it provides, or the pain it relieves. For example, a customer may find value in a luxury brand’s e-commerce platform because of the social status that the product offers them. On the other hand, something like a weekly meal delivery kit fulfills a need they have to eat healthy, home-cooked meals without worrying about groceries.
EXAMPLE
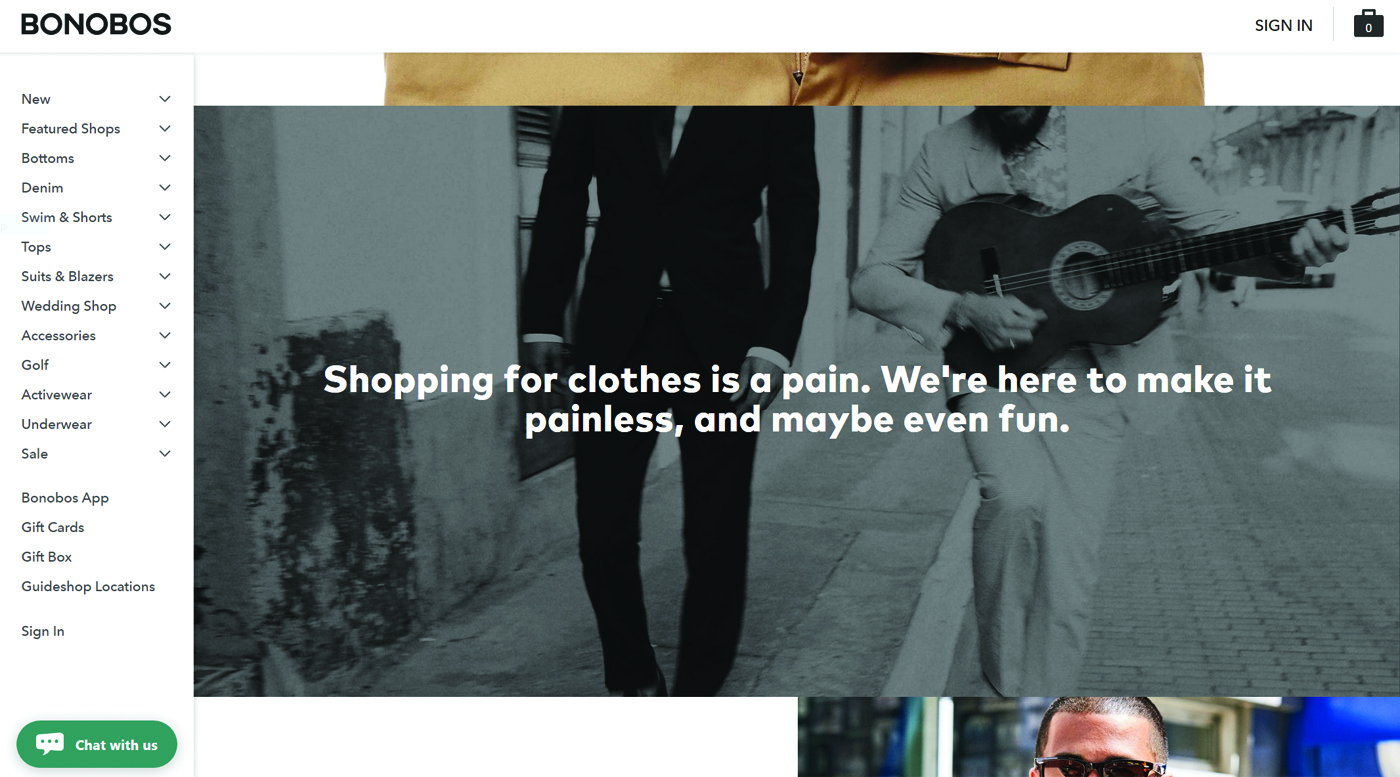
Bonobos plays the transaction game
Men’s clothing brand Bonobos seeks to solve a pain they believe most men seem to have: shopping.
They’ve created a guided, hassle-free shopping experience to help men find their right fit, make purchases online, and have their orders shipped directly to their home. In this value exchange, customers make a purchase in order to fulfill a desire for clothes and for the utility of having those clothes delivered.
Creating customer value in the productivity game
Products playing the productivity game are focused on creating an easy and reliable way for a customer to complete an existing task or workflow. These products provide value by solving a problem customers have, helping customers increase efficiency, or giving them mastery over a particular task. B2B software companies are the predominant players of the productivity game—think products like Evernote or Asana—but can be played by others as well.
More than any other game, those playing to win productivity probably have the hardest time getting customers to realize the full value of their product. Software, no matter how useful or easy you say it is, can be daunting and time-consuming for new users to learn. That’s why being good at the productivity game in today’s era of digital innovation means being laser-focused on product usability. Unlike in the attention game, time spent can sometimes correlate negatively to this value of efficiency.
As a product person, you need to help customers overcome the adoption barrier by creating a desire for your product. You need to make your interface easy to learn and worth their investment in time and money.
Now you know not only how to identify your engagement game, but also how it should inform your north star and the types of customer value exchanges that it should take into consideration.
EXAMPLE
HubSpot plays the productivity game
Boston-based enterprise HubSpot offers a full suite of marketing and sales software that helps teams grow and scale their inbound marketing strategy. Each paid ‘hub’ of HubSpot offers its respective user base efficiency and utility in the form of an all-in-one software.
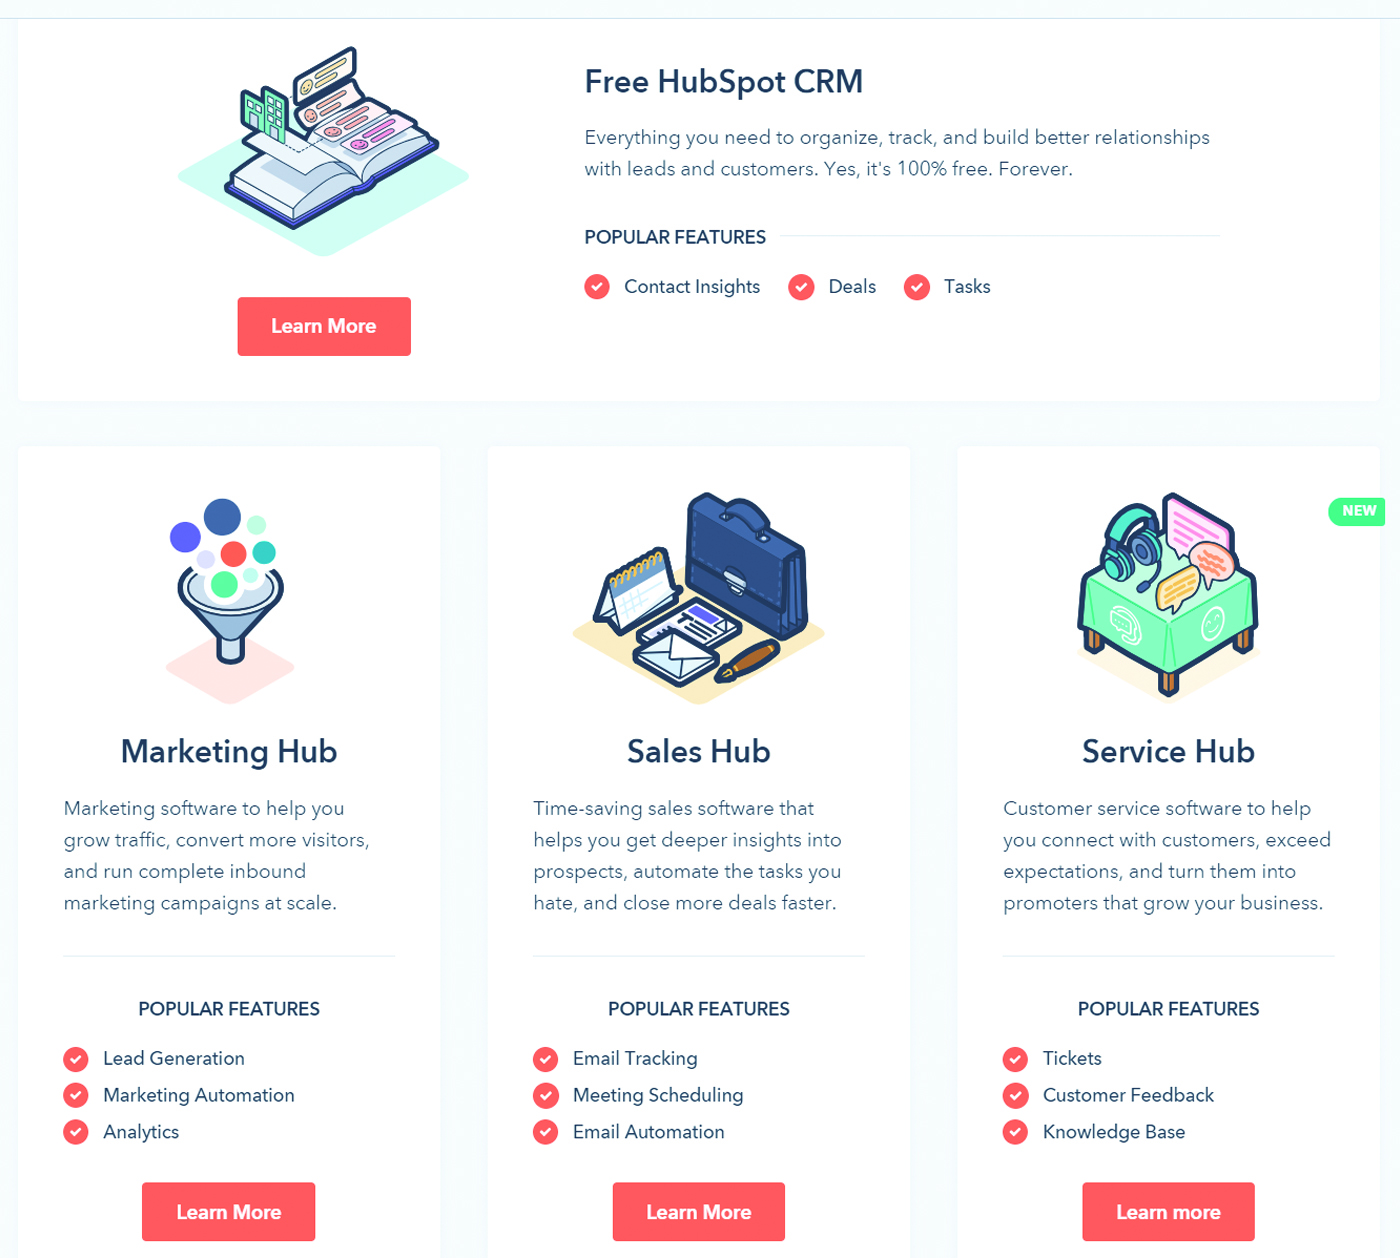
HubSpot’s paid marketing hub, for example, offers everything from blogging and landing page creation to marketing automation and SEO. Instead of using several different, disparate tools to accomplish the same task, an all-in-one platform allows users to create a single, integrated workflow. By easing the pain of learning and managing different marketing tools and workstreams, HubSpot promises marketers mastery of their inbound marketing strategies.
*In the next section, we introduce the concept of the engagement loop, which will help you apply the game framework to your customer growth strategy.*
1.5 | Introducing the Engagement Loop
The engagement loop is an interaction framework that describes the actions and triggers your customers experience when they use your product regularly.
What the Engagement Loop does
This framework helps product teams describe your product’s complete interaction model from the customer’s perspective. This in turn helps the team make better decisions about where in the customer experience a particular feature area fits in and whether it is serving the right purpose.
TERMS TO KNOW
– An engagement loop is an interaction framework describing the actions and triggers that current engaged users cycle through when they use your product regularly.
– A customer-value exchange describes the potential value that products deliver to customers in exchange for the customer’s investment of time and money.
– An aha moment is the moment or set of actions within your product that leads users to first discovering value.
– A trigger is a stimulus that brings users back to a product. This can be an external trigger, such as an email or push notification, or an internal behavioral trigger, such as a pre- existing habit.
– Social proof is the phenomenon wherein a large group of people conform to each others’ behaviors and actions. If users of your product get their friends and acquaintances to also become users, this can be a point of social proof for you.
Why the engagement loop matters
In order to grow, every "engaging" product needs an interaction loop that maximizes the value created in your user’s first session and brings them back regularly. Maximizing value in the first session requires streamlining your product to create value early. With decreasing consumer attention spans, you can no longer afford to have an onboarding flow that doesn’t also create value for the customer. The type of value created might be different from your product’s main workflow, but it’s important to give the user an experience that they want more of.
How to use the engagement loop
Product teams should use the loop to frame their interaction model and lay out a clear hypothesis of how their customers go through each step of the loop. Comparing this to the reality of what customers are experiencing helps clarify where your UX needs to be streamlined and where your product is simply not performing. Keep in mind that companies which don’t have repeat use models (mortgage platforms, for instance) don’t typically need or have loops.
Steps in the engagement loop
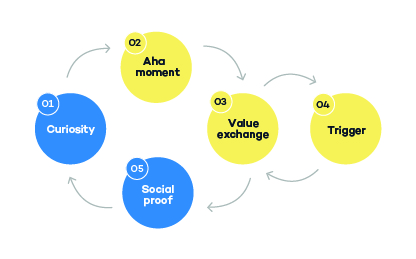
The loop starts with curiosity. New potential customers of your product arrive at it because they are curious. They either saw an ad, were referred by a friend or found you through search and decided to find out more about your product. Maybe they think your product will solve a specific need they have or perhaps they are just browsing.
At this point, your product’s only job is to get them to an aha moment—i.e. show them the best possible value you have to offer in a first session that correlates to them returning. Once they reach their aha moment, your new users are considered activated. The most successful products drive new users to an aha moment during or after their first session.
Next you need engage users in a cycle of recurring value exchange, which we talked about in the section titled *Defining customer value exchange for your game*. With every interaction, you further the value that the customer received.
Once people have sufficiently invested in your product, you can incentivize them to become a point of frequent, repeated social proof. Through incentivized referrals or social media shares, your existing customers can help make multiple future customers curious about your product.
Building in the right engagement elements
Below are some questions you can ask to map your product to this engagement model. This will help you better understand whether your current product workflow has the right engagement elements built into it:
- What am I doing to drive a curious customer to their aha moment?
- What is my recurring unit of value exchange?
- What is the customer investing in that I can leverage to make each subsequent exchange of value more valuable?
- How am I timing my ask for reviews and referrals from customers?Once you have defined the actions that fuel your engagement loop, product and growth managers need to design their UI/UX to accomplish the following:
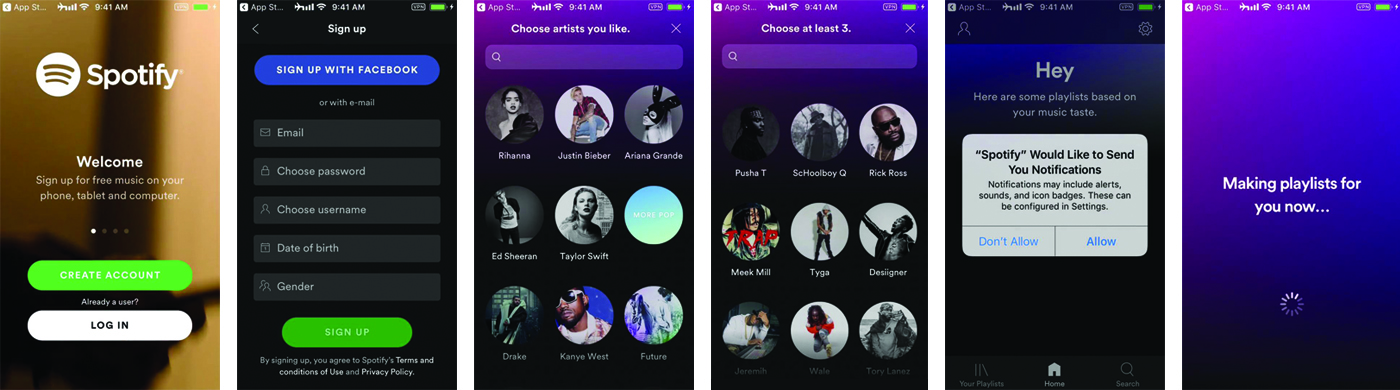
1. Remove any possible barrier to accessing your main value proposition. Streamline your UI to make the a-ha moment idiot proof. No distractions, no wandering, just the minimum steps needed for users to realize that moment of magic. Spotify’s onboarding is a great example of a simple flow that gets users to experience product value as soon as possible. Instead of prompting new users to enter their credit card information and sign up for a Premium trial, it lets them start listening to their favorite songs right away(7).
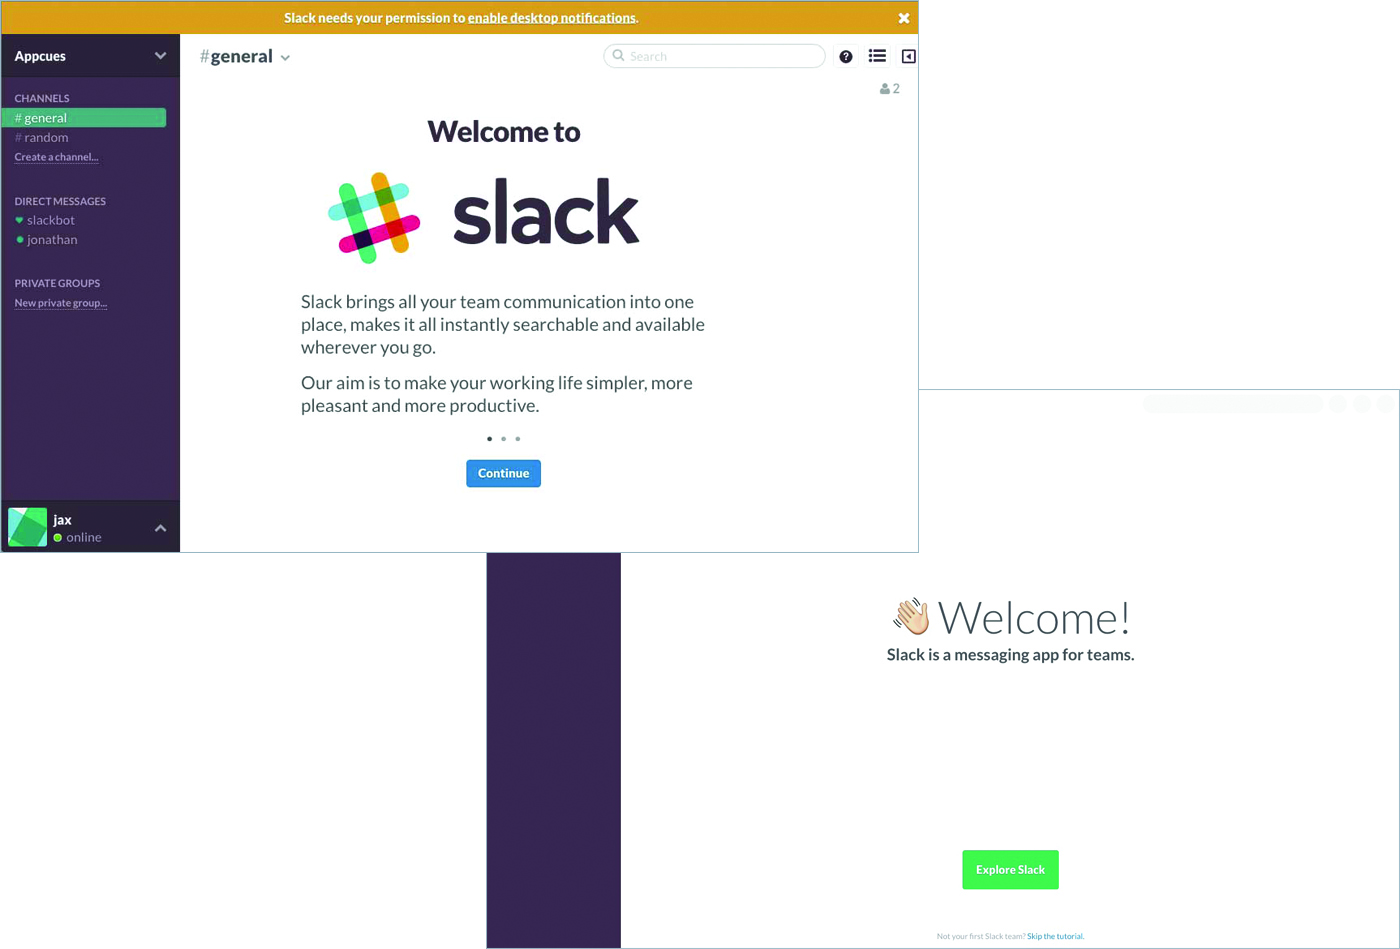
2. Give the customer instant feedback on their actions to affirm the value exchange. Use subtle UX cues to affirm the value exchange so that the customer can clearly follow what happened and take a moment to internalize it, but don’t overwhelm them with copy. Friendly communication and positive reinforcement have always been hallmarks of Slack’s product. The example below shows how Slack changed the last step of their onboarding flow; they replaced their old, copy-heavy welcome and reiterated their value prop in the simplest words possible.
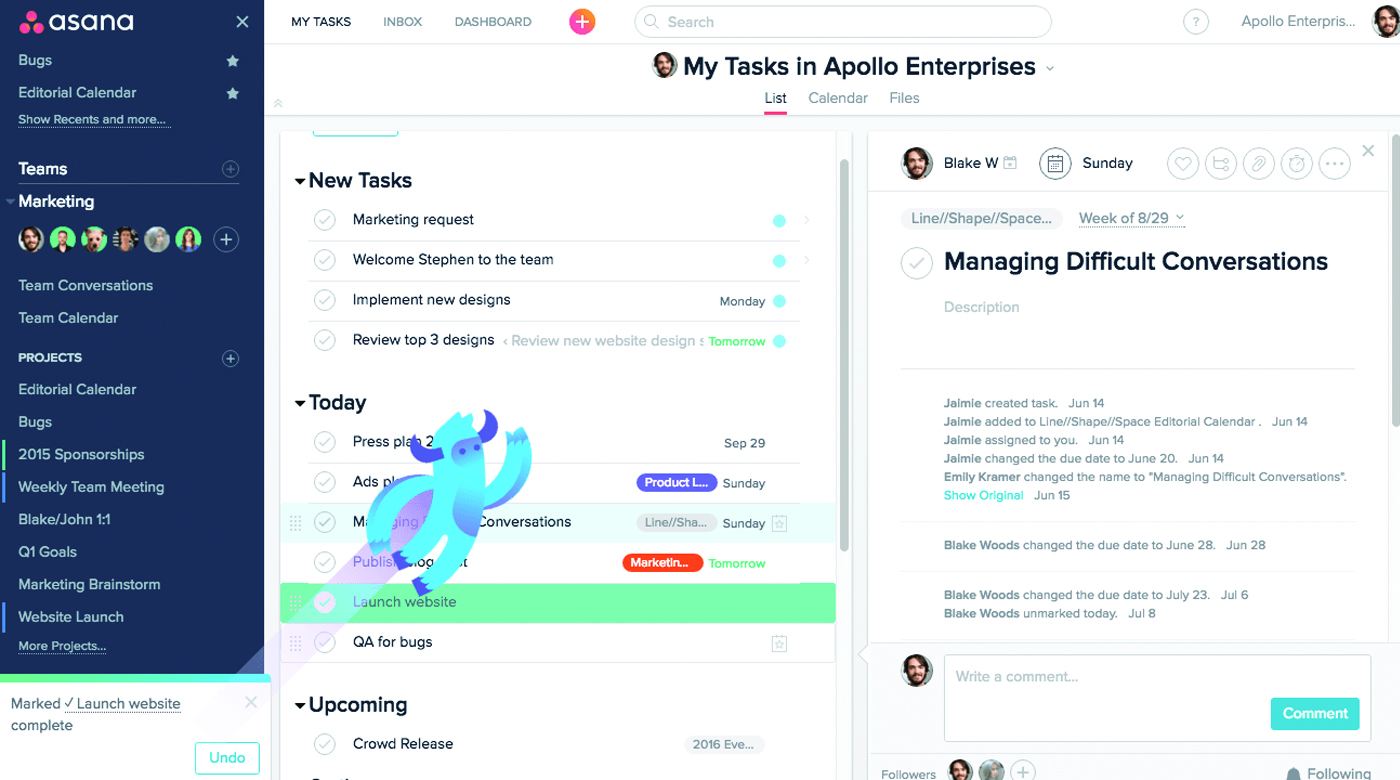
3. Create benefits for customers to increase their investment in your product. Offer rewards to encourage investment behavior. Gamification of your product—by offering login rewards or a weekly ranking against other users, for example—is one way of doing this, but even small, random indicators of achievement can boost how someone feels about using your product. For example, Asana encourages productivity and collaboration with the "celebration" that majestically zooms across the screen when you complete a task.
4. Prompt for referrals and reviews after the customer has already started investing. Every smartphone user has at some point received a popup asking them for feedback or to leave an app store review. The key here is timing. Timing your asks makes a huge difference not just in conversion rate for reviews and referrals but the quality of response you will get. Make sure your customers have been receiving value from your product and are satisfied before asking for a review.
Now you’ve learned at a high level how engagement loops can help inform your growth strategy. We will dive deeper into the different parts of this loop in Chapters 2 and 3 of this playbook but, first, let’s look at how to put numbers and metrics to your engagement game.
In the next section, we’ll do a brief overview of how you can use Amplitude or other product analytics tools to measure your engagement.
1.6 | Measuring your engagement game
"What gets measured, gets done."
– Everybody at this point
Every game needs a scoring system and engagement is no exception. In Section 1.3 on defining north star metrics that drive engagement, we discussed the importance of defining measures that are specific to your product strategy and signified value to the customer as well as the business. Metrics that can meet all these needs are often not trivial to measure. You might not be able to track them easily with traditional web marketing tools designed to track passive web page consumption.
TERMS TO KNOW
In event-based analytics, an event is some action performed by the user or taken by the product. Events and users also have properties, which are attributes that provide context. The process of recording events and attributes as they happen in your product is called instrumentation.
For best practices on instrumenting your analytics, check out our Data Taxonomy Playbook.
Amplitude’s approach to measuring engagement
Amplitude is a product analytics platform. We help product teams analyze user behavior—like engagement—in digital properties. We built this platform for product teams worldwide because the old ways and tools no longer worked. The first generation of the internet was largely formed around passive consumption of media. The analytics platforms that grew around this behavior, like Omniture Sitecatalyst (now Adobe Analytics) and Google Analytics, were optimized to measure page views, bounce rates and sessions to reflect that passive consumption.
With the advent of web 2.0 and mobile applications, the world of digital products has changed dramatically. Users now interact with content and with each other online, performing thousands of actions to engage with products.
Amplitude uses the concept of "events" to capture this user engagement with "properties" to capture the context of the engagement. This framework has become the de facto standard for modern product analytics today.
An introduction to how events and properties capture engagement
An event is a description for an action taken either by a user engaging with a product or taken by the product in response to a user action. Some simple examples of actions for user engaging with a mobile gaming app might be:
- Downloaded app
- Completed registration
- Completed onboarding step 3
- Started game
- Earned 70 XP
- Reward displayed (inactive event)
- Started level 2
In Amplitude, properties provide more context for both events and users. These properties are sometimes called, "attributes" or "dimensions" in other analytics tools. Properties can range from standard values like device type and location to custom values like the user’s current cumulative spend to date in the product.
Defining custom events for complex user engagement patterns
Amplitude helps users create their own custom definitions in real-time using events that have already been instrumented. This can be particularly useful when trying to measure complex engagement patterns that need, "AND" or "OR" conditions to combine different actions together.
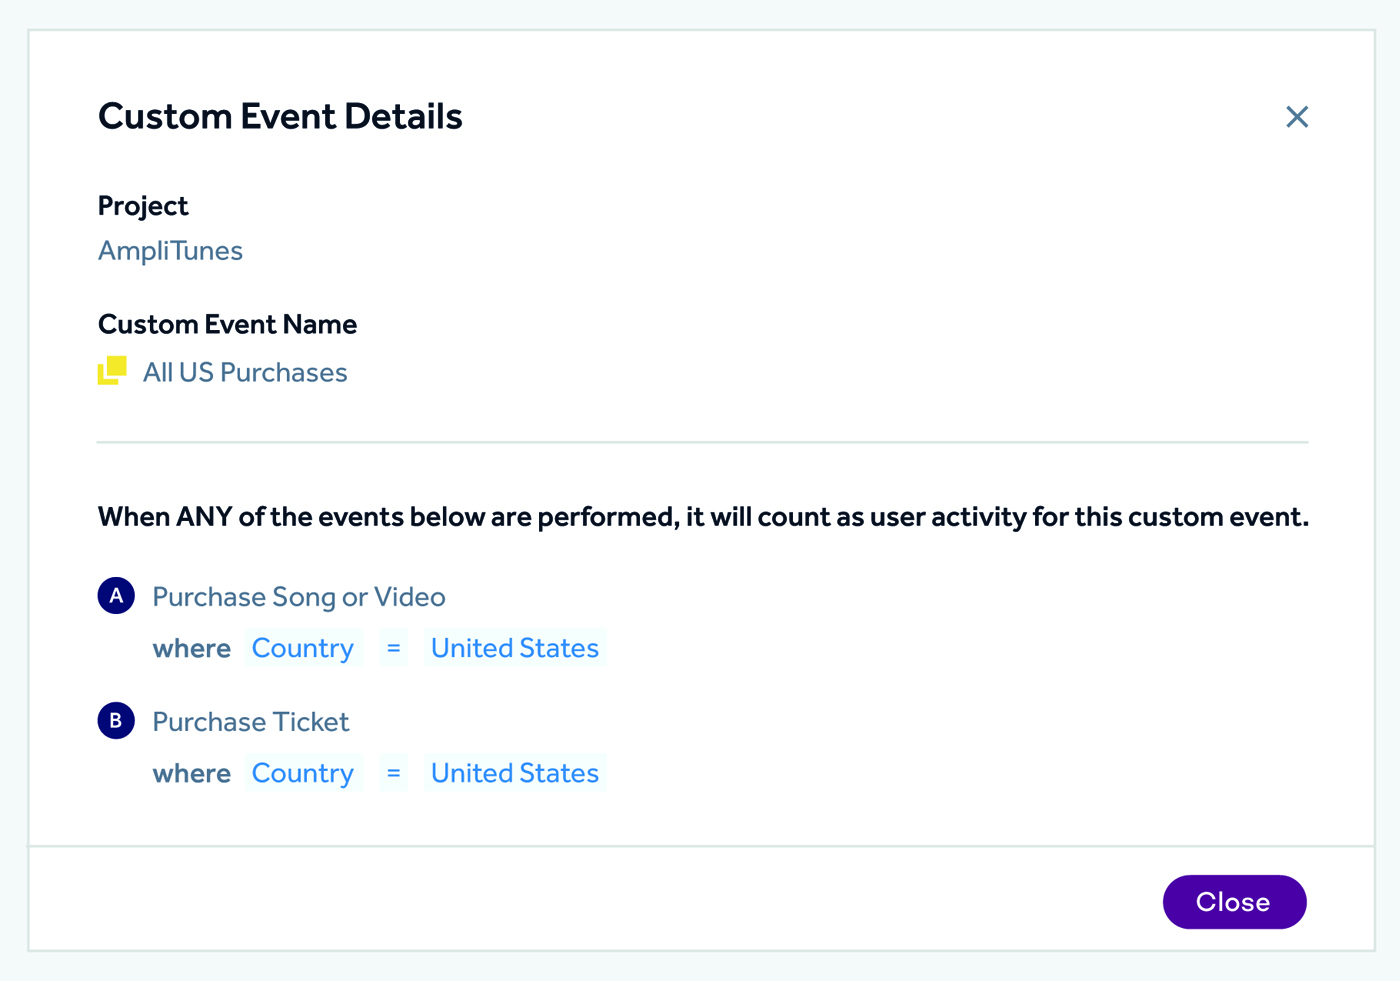
For instance, consider our fictional demo product AmpliTunes. In this product, you can:
- Play and buy songs and videos
- Buy tickets to concerts
If you’re a product manager at AmpliTunes and your product north star metric is number of purchases within the U.S., you can create a composite event by combining the ‘Purchase Song or Video’ event with the ‘Purchase Ticket’ event and then filter by the ‘Country’ user property.
Key measures of user engagement
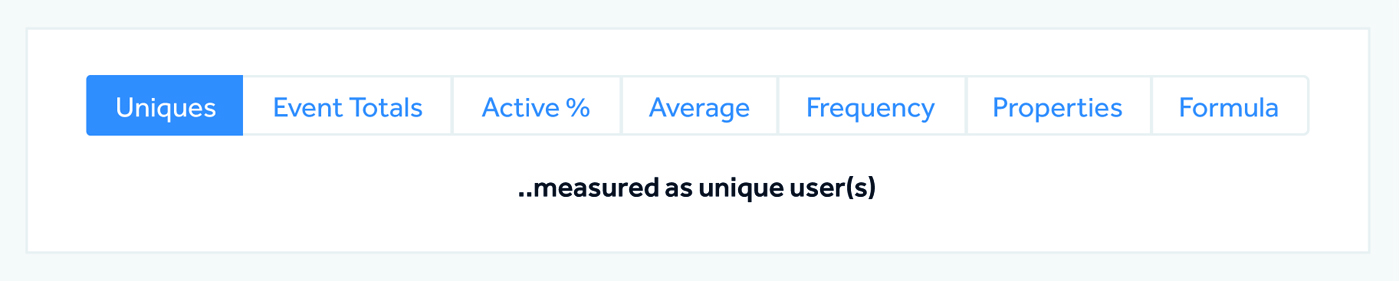
Using Event Segmentation in Amplitude, you can segment events and the users who perform them by user or event properties. In the Metrics Module of this chart, you can choose which metric you want to query by over a selected time frame or in real-time. In the next couple sections, we’ll talk about how to use this module specifically to measure north star metrics in each game.
Metric Definition
Uniques – Shows total unique users who performed a specific event at each data point
Event Totals – Shows the total count of a specific event that was performed at each data point
Active % – Shows the percentage of active users who performed a specific event at each data point
Average – Shows total unique users who performed a specific event at each data point
Frequency – Segments unique users based on their event frequency in the selected interval over the displayed date range
Sum of Property Value – Shows the sum of property values at each data point
Average of Property Value – Shows the average of property values (sum of the values divided by Event Total) at each data point
Distribution of Property Value – Shows the sum of property values at each data point
Formula – Custom formulas that allow you to visualize specific calculations using simple language
Measuring the attention game
Recall if you’re playing the attention game, you care about capturing your customers’ time. In exchange for entertainment, information, and/or self-expression, your users might provide you with ad revenue, subscription fees, or referrals. Well-known products that are winning at this game are Netflix, Spotify, and Twitter, for example.
Do it with Amplitude
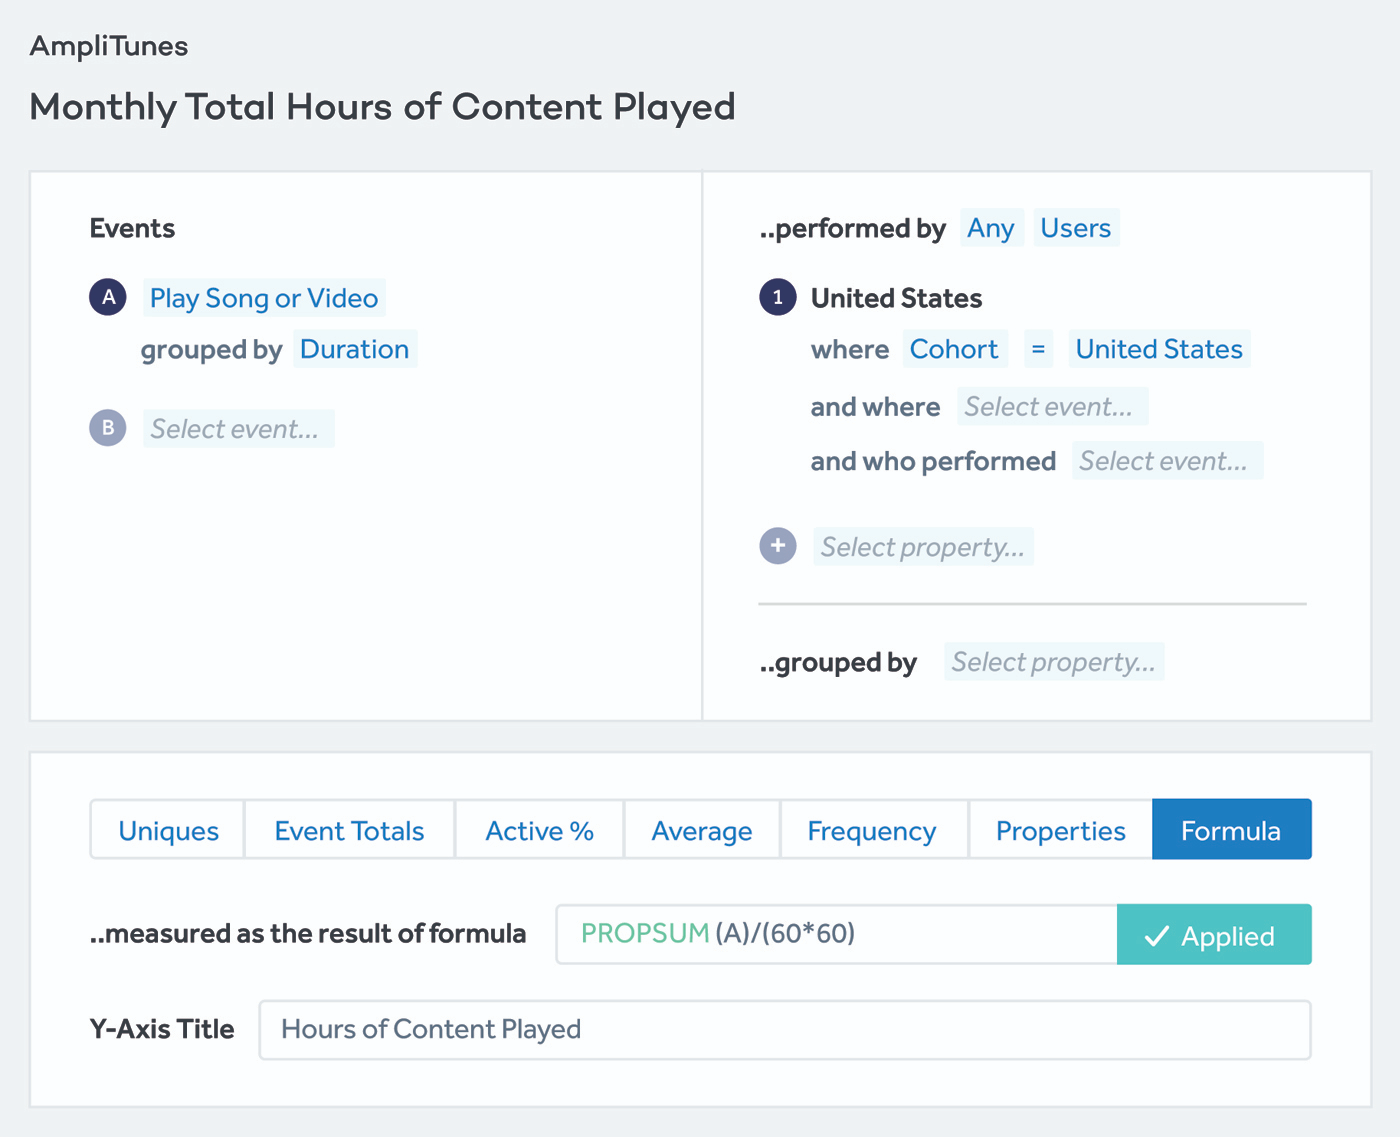
Suppose you are a product manager at AmpliTunes focused on delivering value to your customers through the music and video platform. You are playing the attention game, and your team’s north star is the monthly total time US AmpliTunes customers have spent playing songs or videos. Here’s how you would find your north star in Amplitude:
STEP 1: Create a new Event Segmentation chart and choose the user action ‘Play Song or Video’ in Events Module on the left.
STEP 2: Group this action by the event property ‘Duration.’ This property contains the duration of the content played measured in seconds.
STEP 3: To only look at the segment of your users in the U.S., choose to view users who have their ‘Country’ property as the United States. You can also compare this segment to all of your users by adding an All Users segment right below.
STEP 4: Now it’s time to do the analysis. Move to the Measure Module at the bottom and choose to measure by the formula PROPSUM, or property sum. PROPSUM(A) will add up all the values in the ‘Duration’ property for the action you specified in Step 1 at every data point. To convert this into hours, divide by 60*60 (1 hour = 60*60* seconds). Then, make sure the date picker is set to Monthly, so you’re seeing monthly totals.
OR
Instead of using the Formula measure, you can directly choose the "Properties" measure and in the dropdown, "Sum of Property Value." Note that if you do this, the resulting value will be in the whatever unit the property value is in; in this case, the total monthly duration will be in seconds, not hours.
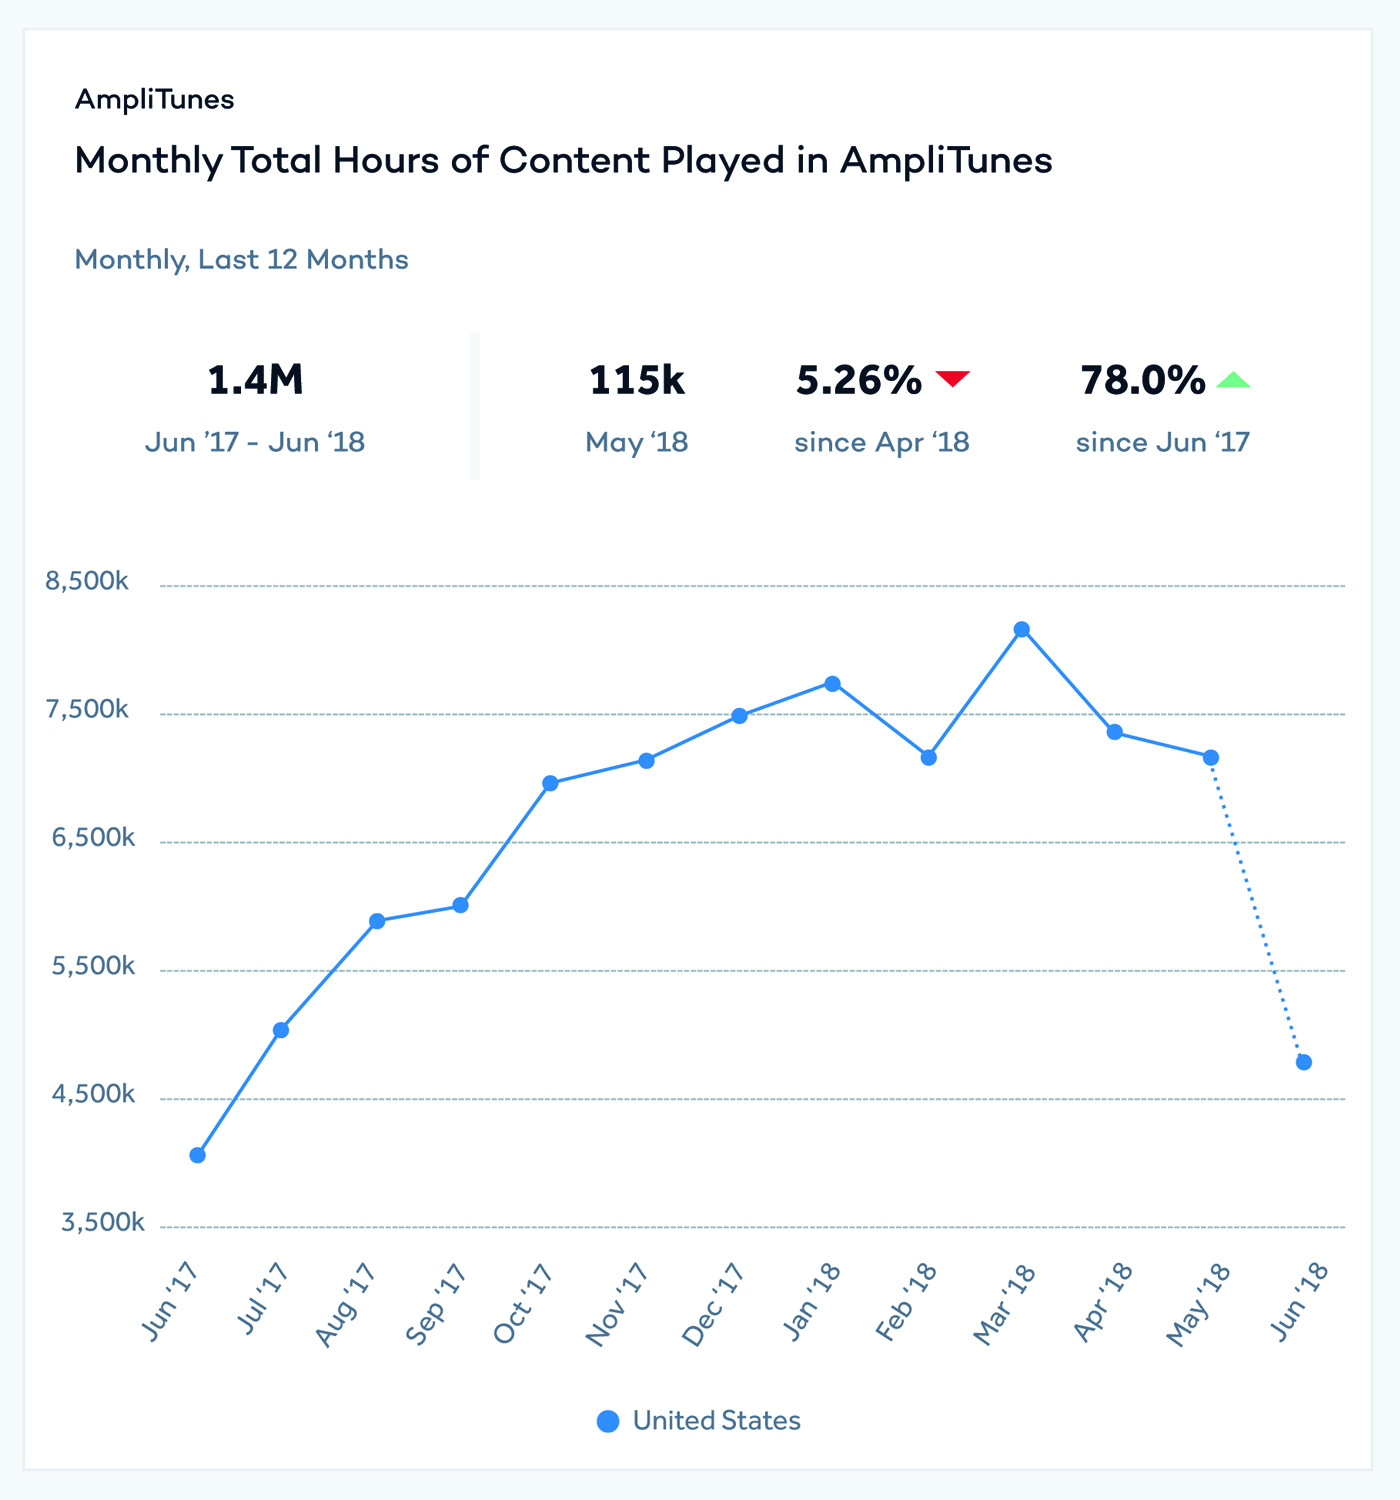
Takeaway
If you’re playing the attention game, you probably have a north star related to measuring how much of a user’s time you are capturing. This means you’ll need to make sure you’ve instrumented an event property related to the duration of some user action; you can then perform operations on this metric either with custom Formulas or using the Properties measure. Alternatively, if you care about session time, you can create a User Sessions chart type.
Measuring the transaction game
Remember if you’re playing the transaction game, you care about the number of transactions your users make. In exchange for the ability to acquire something they need or desire, your users provide you with purchases, price signals, and sometimes ad engagement. E-commerce businesses are typically the main players of this game—including giants like Amazon, as well as monthly subscription boxes, and on-demand delivery services.
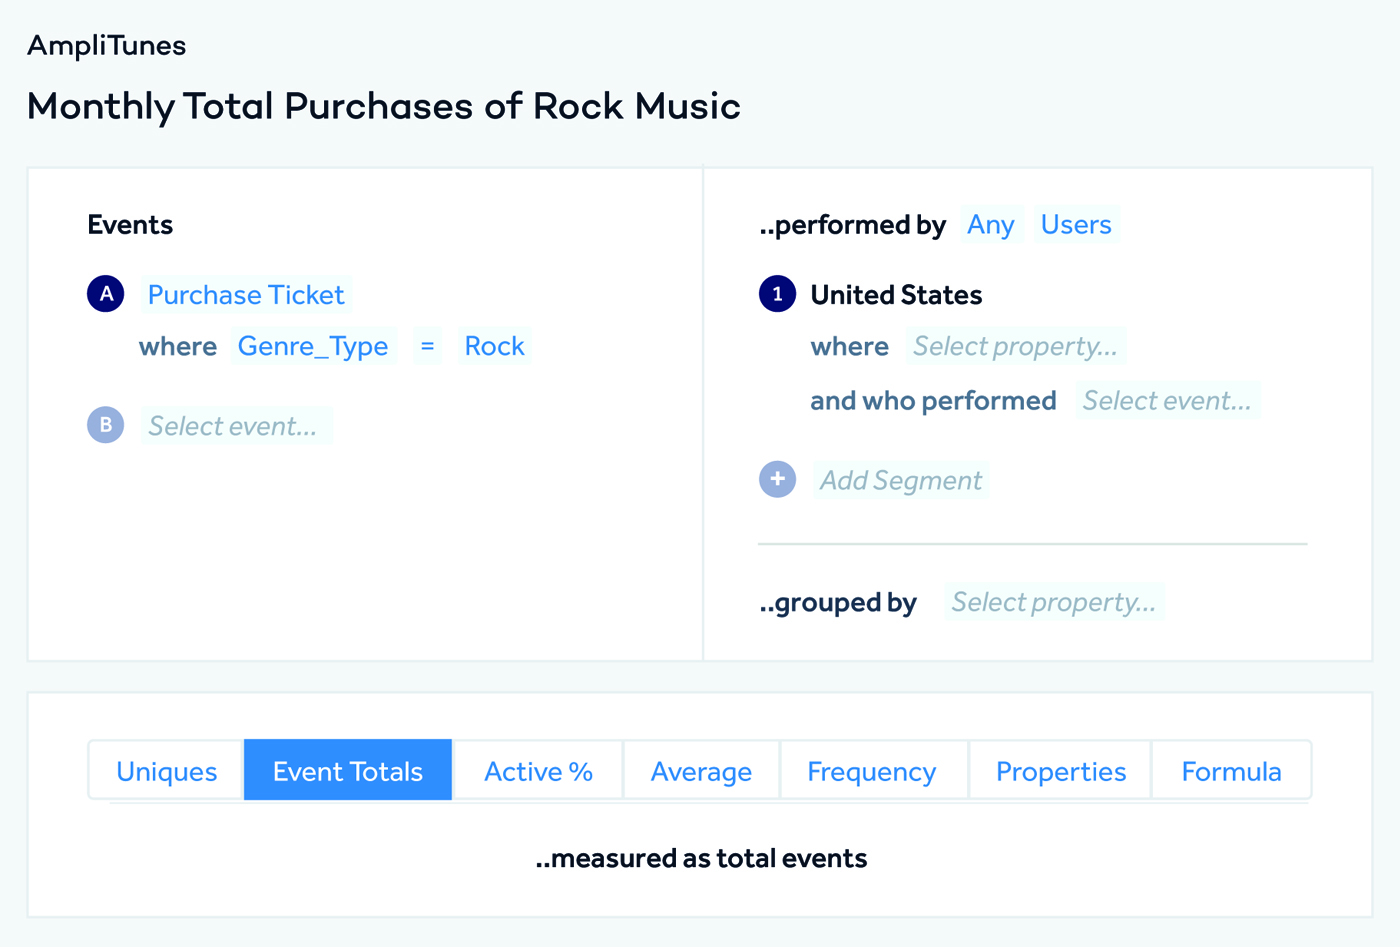
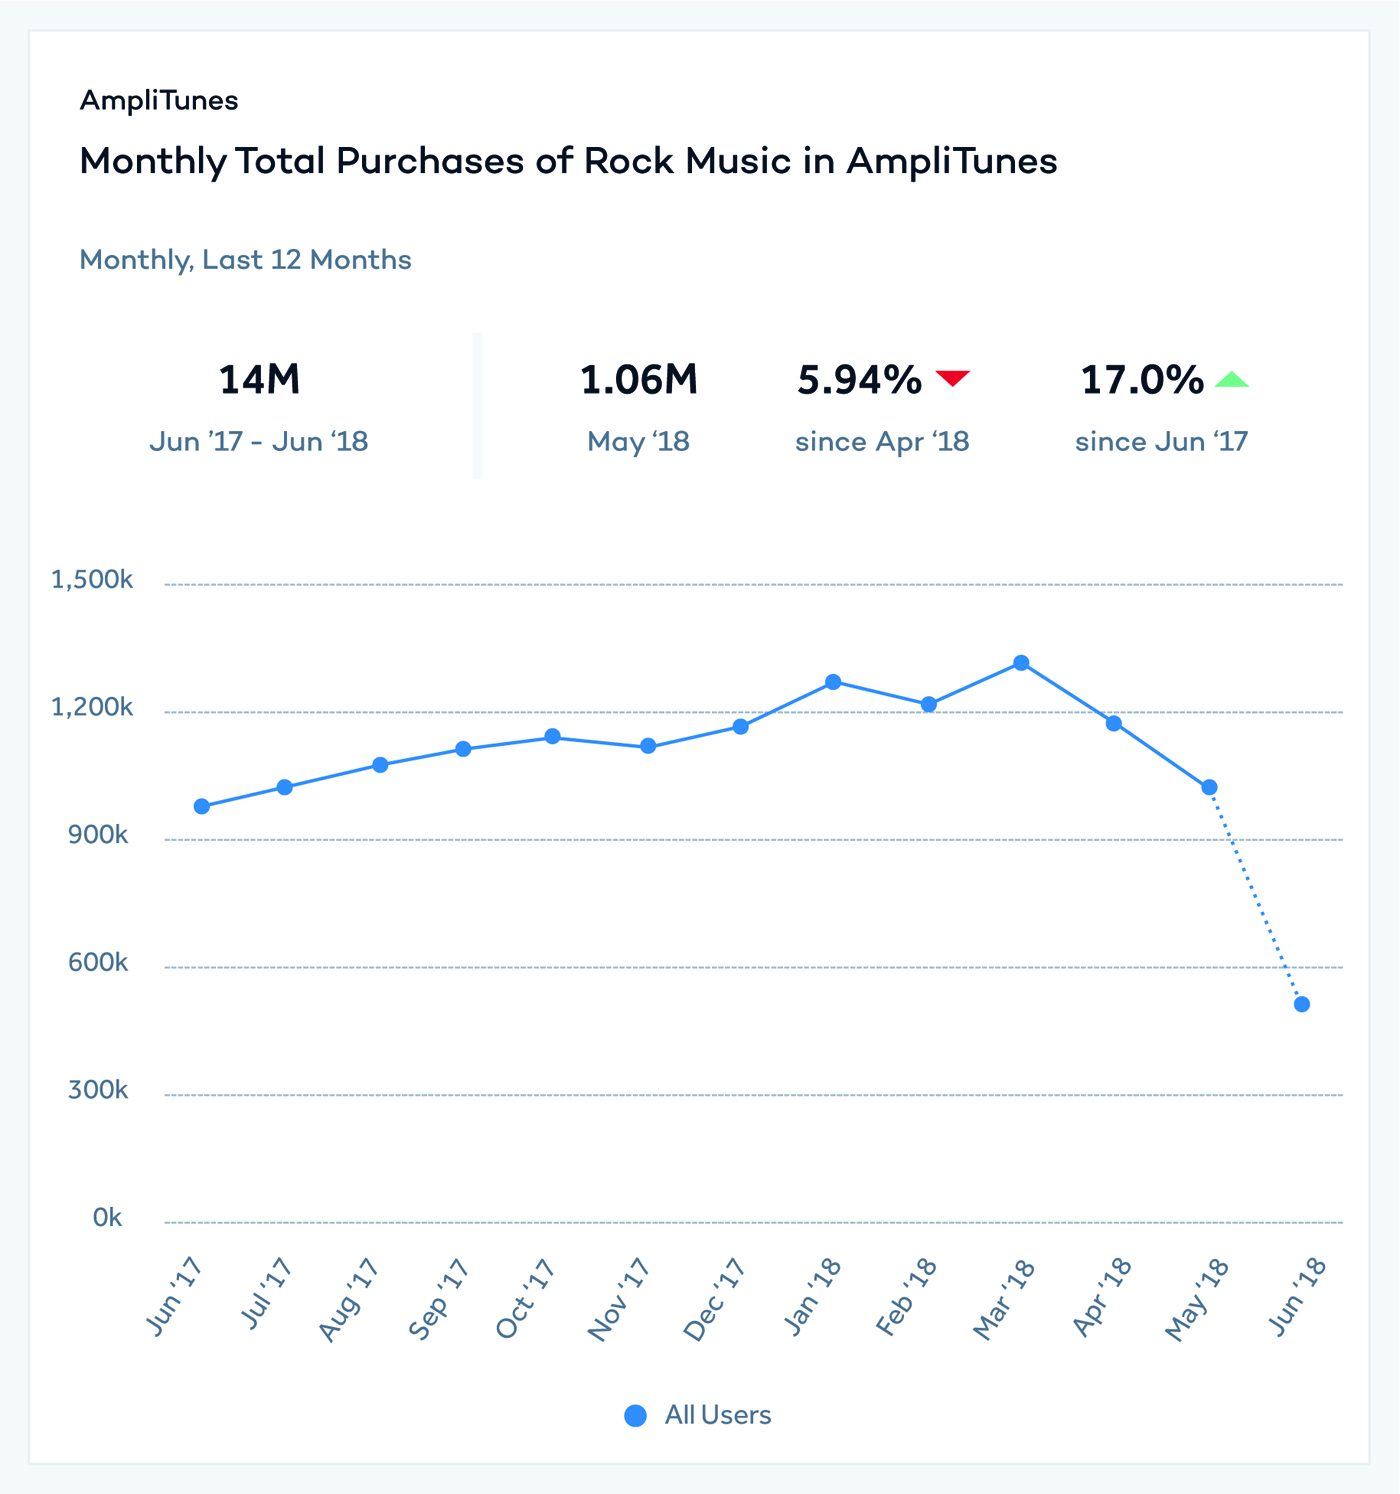
Now suppose you are a product manager on the other major product at AmpliTunes focused on delivering value to your customers through concert ticket sales. Now you are playing the transaction game, and your team’s north star is monthly total purchases of rock music tickets customers have made globally. Here’s how you would find this North Star in Amplitude:
STEP 1: Create a new Event Segmentation chart and choose the user action ‘Purchase Ticket’ in Events Module on the left.
STEP 2: Filter the user action by setting ‘Genre Type’ to Rock. This allows you to only look at ticket purchases for the rock genre.
STEP 3: Since you want to look at rock music ticket purchases made by all of your customers world- wide, make sure the Segmentation Module on the right is set to Any Users.
STEP 4: Now it’s time to do the analysis. Move to the Measure Module at the bottom and choose to measure by Event Totals. This will show total number of times the action ‘Purchase Ticket’ with the ‘Genre_Type’ Rock was performed at each data point. Then, make sure the date picker is set to Monthly, so you’re seeing monthly totals.
Takeaway
One of the north star metrics that most players of the transaction game care about is the number of transactions happening over some period of time, across various user segments. Use Event Totals when you want a count of how many times a purchase action was performed in a specific time frame.
Measuring the productivity game
Players of the productivity game care about users performing high-value digital tasks. In exchange for the ability to complete tasks with efficiency and mastery, customers often pay for a subscription or license for the software. Players of the productivity game are often (but not limited to) B2B companies, like Slack, Asana, Salesforce, and others.
Do it with Amplitude
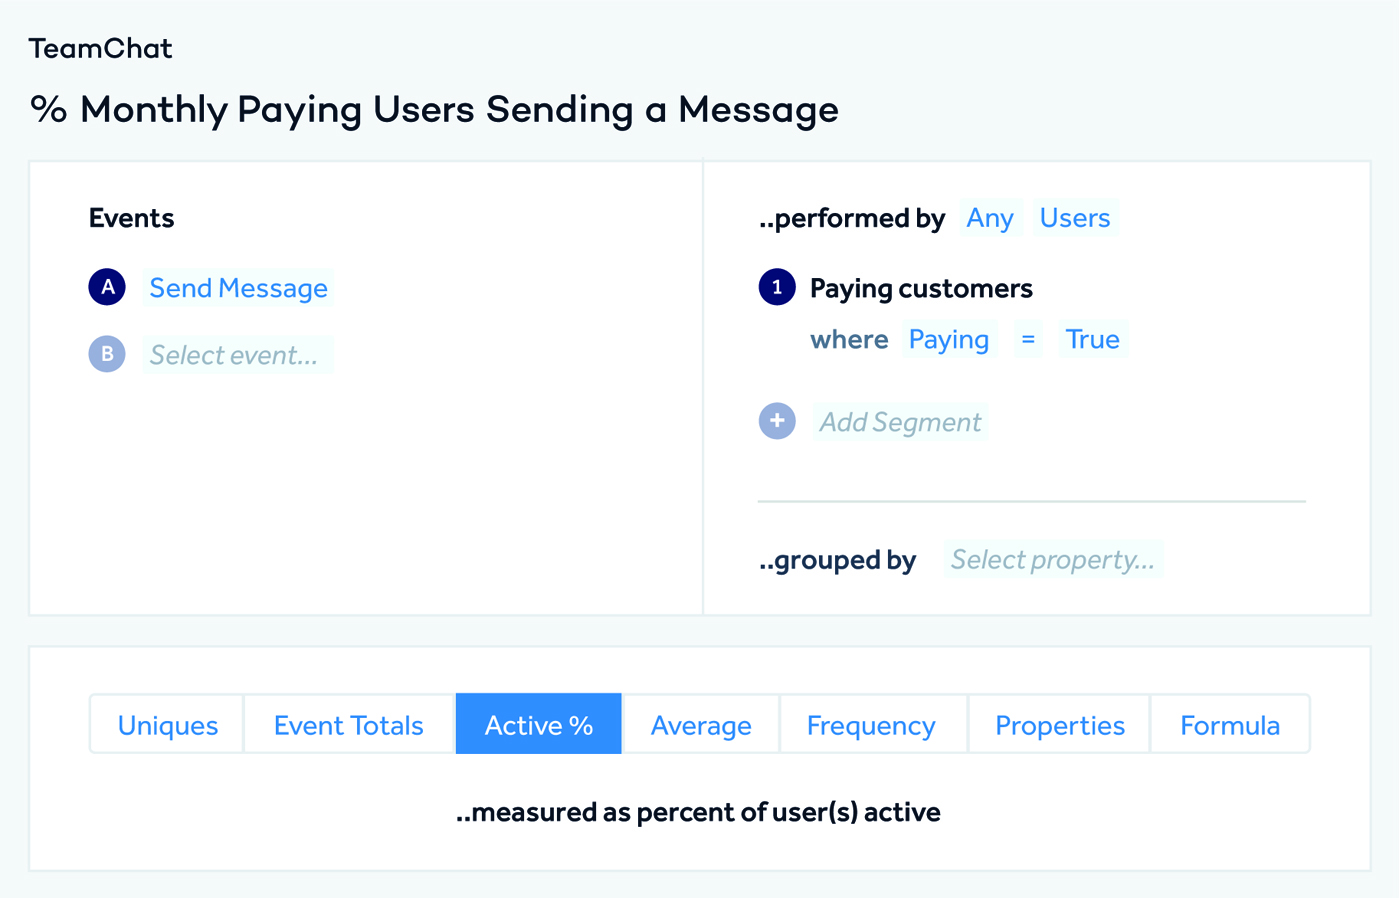
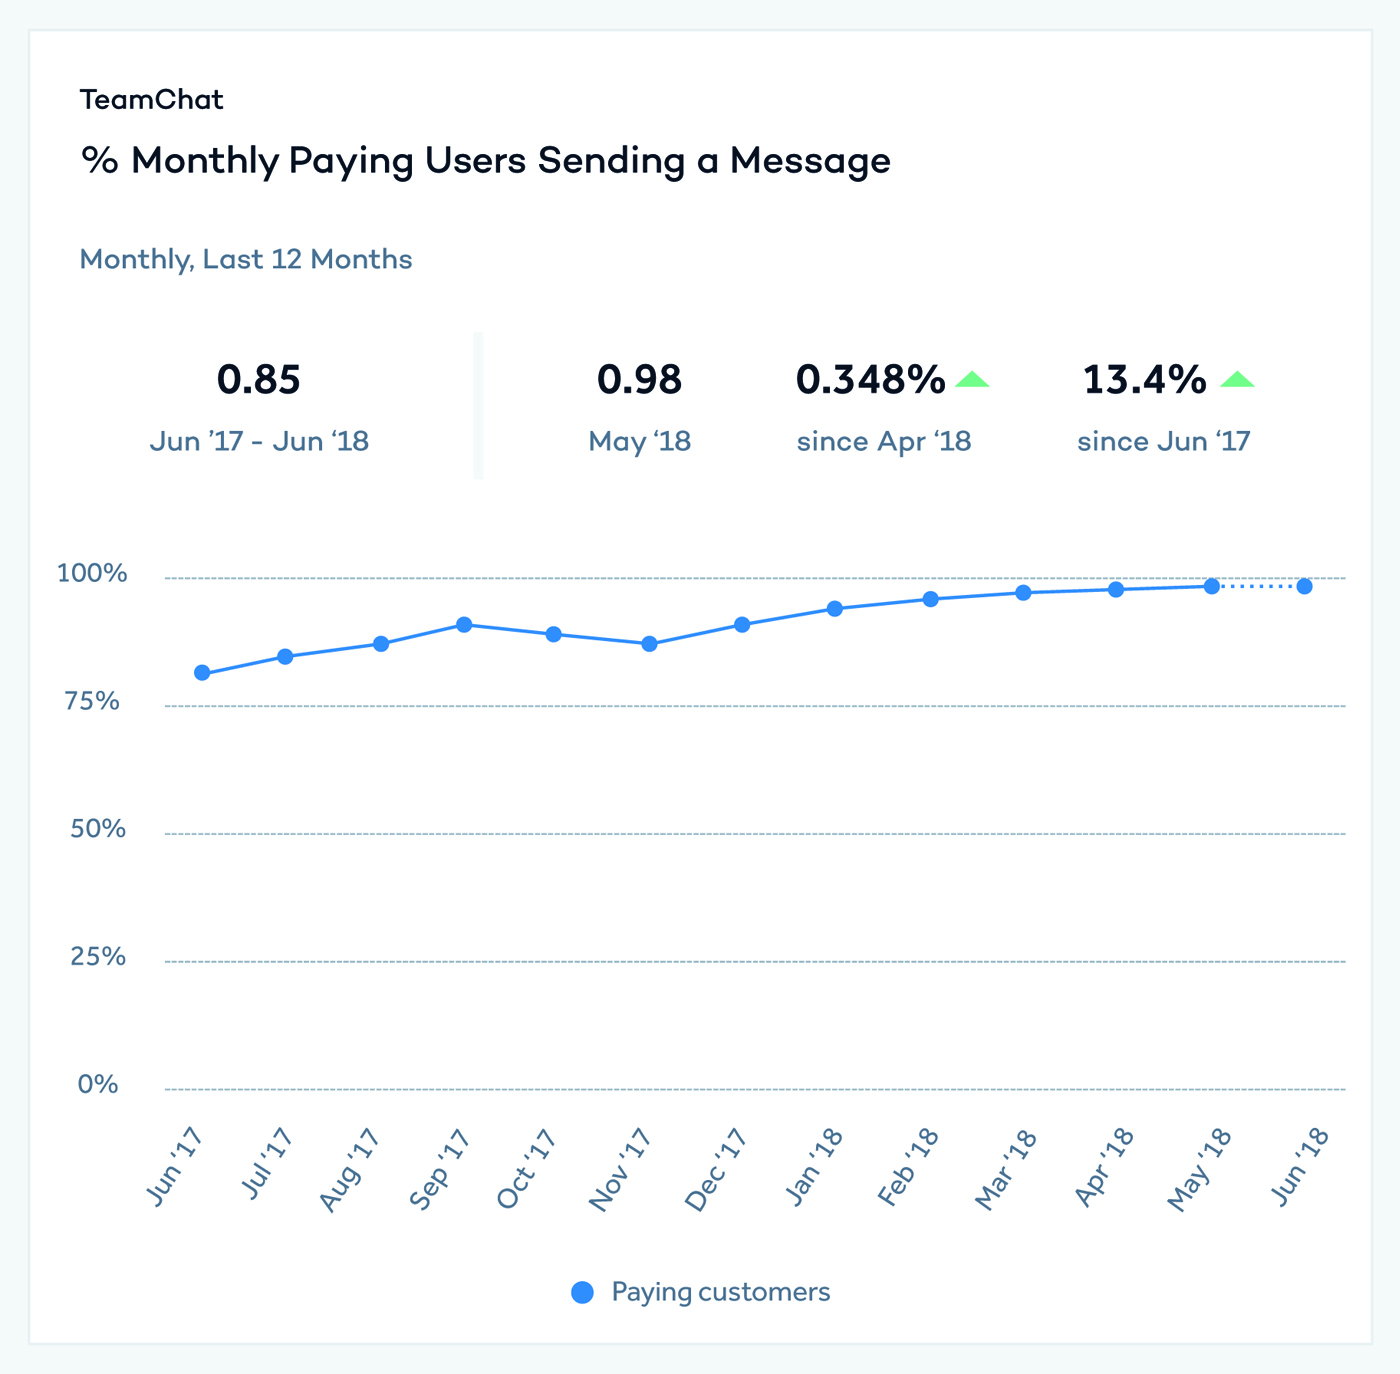
Let’s consider a demo product called TeamChat, a B2B communication software like Slack. Now you are playing the productivity game. This team’s north star is the percent of monthly active paid subscribers who have sent a message. Here’s how you would find this north star with Amplitude:
STEP 1: Create a new Event Segmentation chart and choose the user action ‘Send Message’ in Events Module on the left.
STEP 2: To only look at paying customers, create a segment of all users who have their user property ‘Paying’ set to the value true using the Segmentation Module on the right.
STEP 3: Now it’s time to do the analysis. Move to the Measure Module at the bottom and choose to measure by Active %. This will show the percentage of active paying users who did the action ‘Send Message’ at each data point. Note that by default, Amplitude defines an active user is a user who has performed at least one action on a particular day. Then, make sure the date picker is set to Monthly, so you’re seeing monthly percentages.
Takeaway
The core metric for products playing the productivity game is number of active users performing high-value tasks on a regular basis. One way to assess how well certain features of your product resonate with your users and how much value it delivers is to use Active % to see exactly what proportion of your active paying users use that feature to complete an intended task.
1.7 | Taking action on your engagement game
This chapter introduced the Three Games of Engagement model: the attention game, the transaction game, and the productivity game. Deciding which game your product is playing is critical because it forms the crux of your engagement strategy. With the right game in place, you can then:
- Define a good product north star
- Determine what value your product offers to your customers and the value they offer to the business in exchange
- Understand how to build an engagement loop that keeps the value exchange going
Further Reading
If you’d like to dive deeper into some of the topics we covered in this chapter, we suggest starting with these articles and books:
The Hierarchy of Engagement, expanded
Sarah Tavel, General Partner at Benchmark, formerly Product at Pinterest
Don’t Let Your North Star Metric Deceive You
Brian Balfour, CEO of Reforge; Shaun Clowes, formerly Head of Growth at Atlassian; Casey Winters, formerly Product at Pinterest
Hooked: How to Build Habit-Forming Products
Nir Eyal, Best-Selling Author
Before moving on to Chapter 2: New User Activation, take a moment now to reflect on your learnings from Chapter 1 and consider the following:
– Which of the three engagement games is your product is playing?
– Describe the customer value exchange that happens within your product.
– How does your product north star relate to the game you are playing? How does it reflect the value you want customers to get from your product?
– Name some key engagement elements in your product that will move a new user through the Engagement Loop
– Complete the following worksheet on your north star metric.
Worksheet Download
Mapping your product team’s north star metric
Special Thanks
Special thanks to the team at Optimizely and Braze, as well as our customers Blue Apron and Postmates, for partnering with us to share their engagement use cases. Also thanks to Nir Eyal for sharing his expertise on user engagement and Sarah Tavel for her support.
And finally, thanks to all of the teams who use Amplitude: you inspire us with your stories and provide invaluable feedback. This book (and Amplitude) wouldn’t exist without you!
A note on examples
Although this playbook draws on real-life examples from companies that we work with, we have altered examples to prevent disclosing specific companies and their real data. We’ve tried to preserve the lessons and principles behind the examples as much as possible.